


Financial Highlights
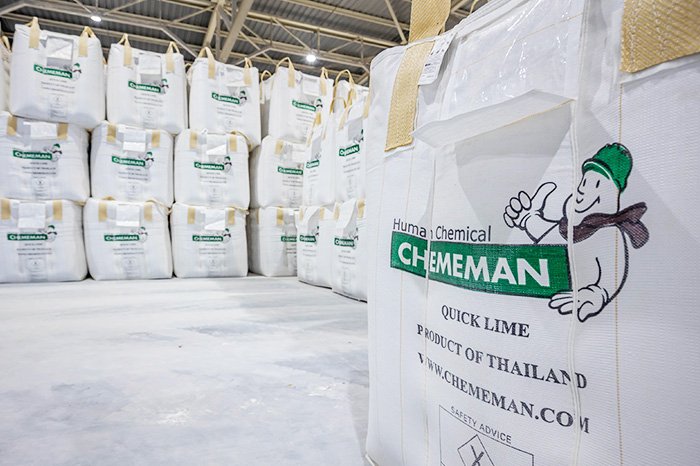
Chememan Human Chemical
“The group of companies aims at achieving lime capacity of more than 2,000,000 tons per year by 2025 to become a world-class leader in lime industry by conducting business with good governance that provides sustainability for all concerned parties.”
tons per year by 2025
Note:
% Comparison of Financial Performance: 9M2025 vs. 9M2024
Return on Equity = Net income attributable to holders of company /Equity attributable to owners of company (average)
Capital Expenditures = Cash outflow for capital expenditures
Proportional Adjusted Net Debt = LTD + STD - Cash
Adjusted Free Cash Flow = EBITDA – Taxes – CWC – CAPEX
Total Liabilities to Equity = Total liabilities / Equity attributable to owners of company
Interest Bearing Debt to Equity = Total interest-bearing debt / Equity attributable to owners of company
| 2023 | 2024 | 3Q2024 | 3Q2025 | |||
|---|---|---|---|---|---|---|
| Statement of Comprehensive Income | ||||||
| Revenues | (million baht) | 3,505 | 3,826 | 877 | 789 | |
| Net income (loss) attributable to CMAN | (million baht) | 136 | 252 | (96) | 41 | |
| Earnings (loss) per share attributable to CMAN | (baht per share) | 0.14 | 0.26 | (0.10) | 0.04 | |
| Adjusted net income (loss) attributable to CMAN (*) | (million baht) | 220 | 395 | 88 | 50 | |
| Adjusted earnings (loss) per share (*) | (baht per share) | 0.23 | 0.41 | 0.09 | 0.05 | |
| Adjusted EBITDA excluding special items (*) | (million baht) | 820 | 1,022 | 218 | 174 | |
| 2023 | 2024 | 3Q2024 | 3Q2025 | |||
|---|---|---|---|---|---|---|
| Statement of Financial Position | ||||||
| Current Assets | (million baht) | 1,121 | 1,495 | 1,139 | 1,115 | |
| Total Assets | (million baht) | 6,395 | 6,472 | 6,159 | 6,009 | |
| Current Liabilities | (million baht) | 2,039 | 1,959 | 2,105 | 1,499 | |
| Total Liabilities | (million baht) | 3,975 | 3,925 | 3,688 | 3,337 | |
| Shareholders' Equity | (million baht) | 2,420 | 2,547 | 2,471 | 2,672 | |
| Financial Ratios | ||||||
| Current Ratio | (times) | 0.55 | 0.76 | 0.54x | 0.74x | |
| D/E Ratio | (times) | 1.68 | 1.57 | 1.51x | 1.27x | |
| Net Profit Margin | (%) | 3.88% | 6.58% | (10.64%) | 5.14% | |
| Return on Asset | (%) | 2.07% | 3.91% | 2.19% | 5.96% | |
| Return on Equity | (%) | 5.87% | 10.33% | 5.70% | 14.29% | |
Calculations:
(*) Excludes all special items, such as realized and unrealized foreign exchange gains/losses from loan conversions and mark-to-market gains/losses from forward contracts, losses from the impairment of financial assets and one-time extraordinary revenues or expenses
Net Profit Margin = Net Income(loss) attributable to CMAN / Revenues from sales and service
Return on Asset = Net Income(loss) attributable to CMAN / Average Total assets
Return on Equity = Net Income(loss) attributable to CMAN / Average Shareholders' equity